Sample project for a fictional business, made to show what you get. Fable & Foam Brewing is not a real company.
Fable & Foam's owners knew roughly how the month went, but not where money was slipping away. The numbers were all there, spread across invoices and the bookings calendar, and nobody had time to pull them together.
Open the sample dashboard (opens in a new tab): one page built from twelve months of the brewery's made-up invoices and bookings.
One page, once a month
Each month the business drops its invoice and booking exports into a shared folder it owns. The dashboard is rebuilt from those files and read top to bottom in a couple of minutes, on a phone or a desktop:
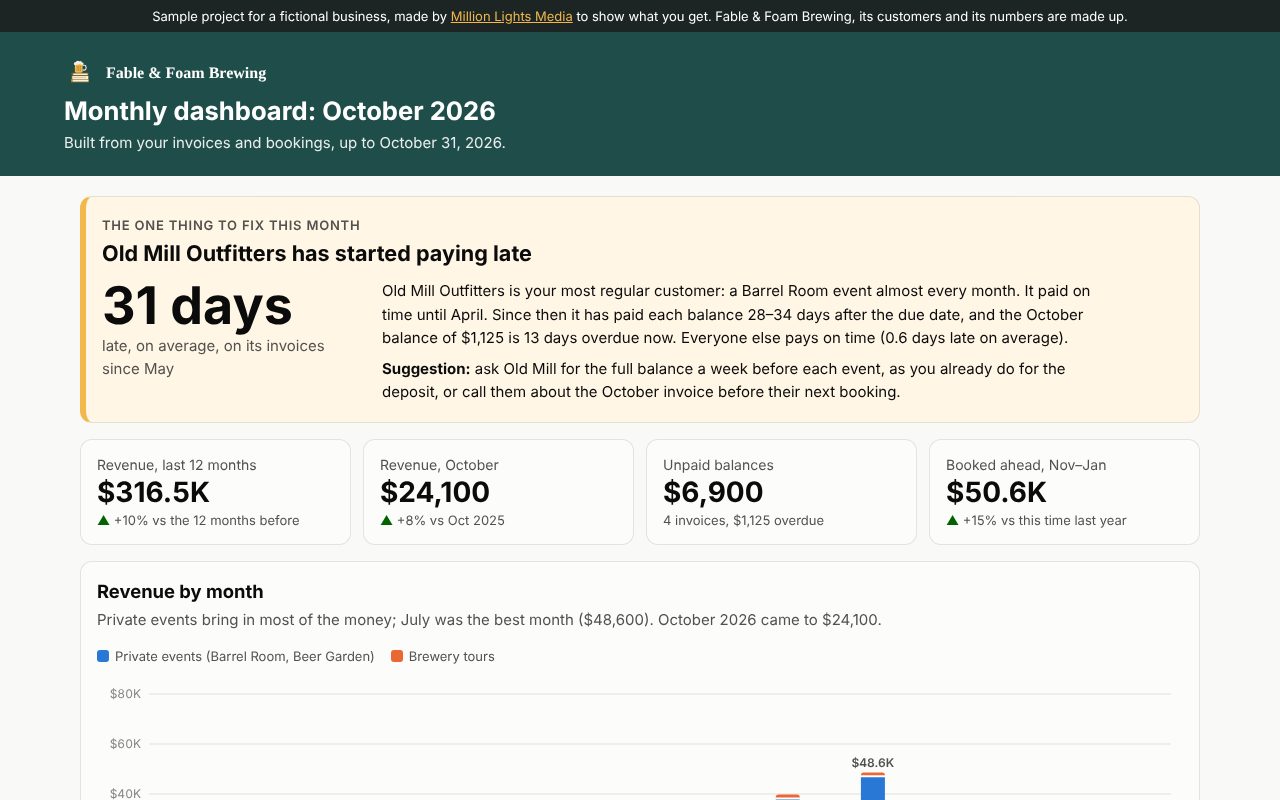
- The one thing to fix this month, first. For Fable & Foam it's a regular corporate customer that used to pay on time and now pays about a month late, with its latest invoice overdue, plus a suggestion for what to do about it.
- Key numbers: revenue for the last twelve months and for this month, compared with last year; what's unpaid; and how much is already booked for the coming months.
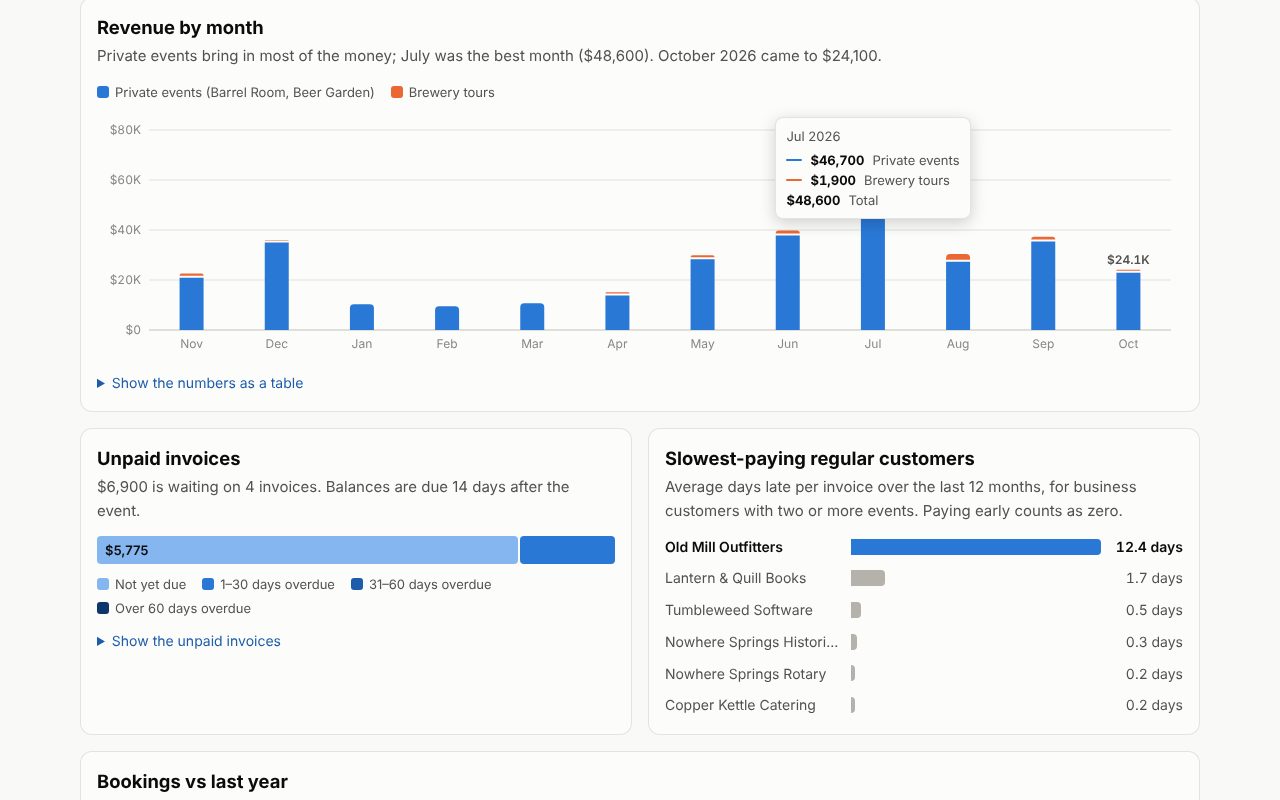
- Revenue by month, private events and brewery tours.
- Unpaid invoices by age, and the slowest-paying regular customers.
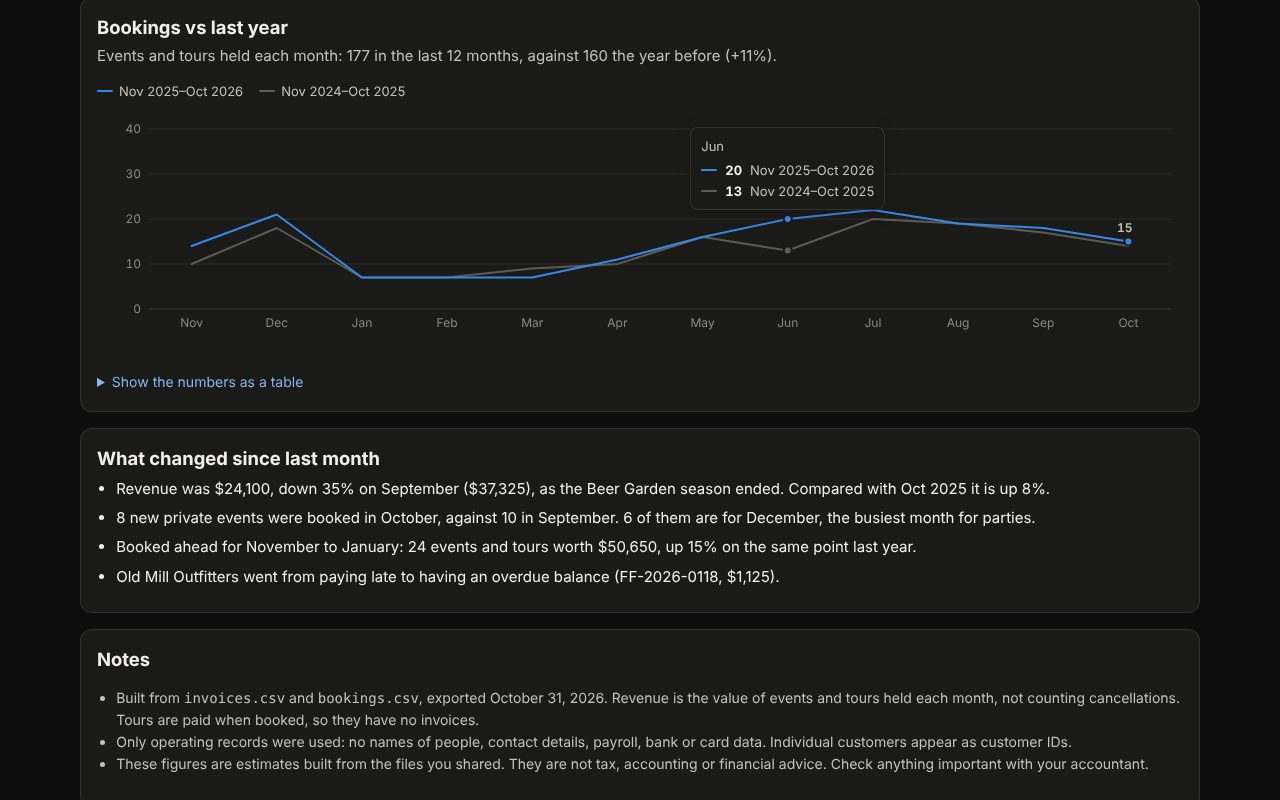
- Bookings against last year, month by month.
- What changed since last month, in plain sentences.
Every chart also has a table view.
Only the data a business is happy to share
The dashboard works from operating records only: invoices, bookings and sales totals. It refuses personal details, payroll, and bank or card data. Individual customers appear as the business's own customer IDs, and files that contain names or contact details are sent back to be exported again. The raw files are deleted 30 days after each month's dashboard is built.
The figures are estimates built from the files the business shares, not tax, accounting or financial advice.
Fable & Foam, its customers and every number on the dashboard are made up. Want a page like this for your own business? Get in touch.